Documentation:
NINO general infoNINO is a web based network management solution. It uses SNMP (Simple Network Management Protocol), WMI and HTTP/TCP service response to monitor hosts and network devices. NINO is running on a web server and NINO can be accessed by any computer with a web browser.
The main functions of NINO are:
NINO originated from the Unix world. Using Perl and Java NINO is platform independant. NINO is a package containing Perl modules on the server and Java Applets to display graphs and the NodeMap. NINO uses a webserver to take care of the user interface. The NINO services are background processes to take care of monitoring and event handling. More information about processes can be found in NINO Services.
The NINO services are used to receive SNMP traps and collect monitoring data. Threshold and status monitoring is used to send alerts to the trapd process if a threshold is exceeded or a device is down. All traps are stored as events in the database. All events can also be processed using eventaction. The eventaction process can send e-mail notification, send escalation alerts or execute scripts. All monitoring data is stored on the filesystem and can be used to create reports, graphs or status views.

NINO uses a web server to serve web pages. NINO uses a database to store events and the NINO services to collect monitoring data.
All NINO processes are controlled by the services process.
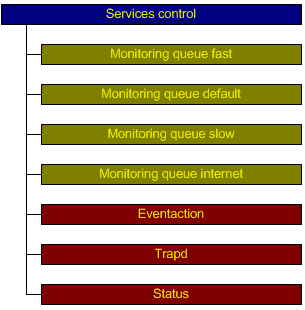
Processes:
By default NINO has several monitoring queues to handle monitoring. Each queue can be configured with a cycle duration in seconds. The services process will control all monitoring queues, such as manual stop or start, automatic restart if the queue is down or hanging. It is possible to create new monitoring queues and alter cycle times. Also test queues can be defined to test new monitoring presets or realtime troubleshooting with a cycle refresh of 10 seconds.
Detailed description table of NINO processes:| NINO Processes | Description | Name | Controlled by |
| Monitoring | Collect monitoring data | monitor.pl | services.pl |
| Status | Status check, Ping or Uptime | status.pl | services.pl |
| SNMP Trap listener | Receive and forward SNMP traps | trapd.pl | services.pl |
| Event actions | Execute event actions, such as e-mail notification or send escalation alerts | eventaction.pl | services.pl |
| NINO Services | Control NINO services | services.pl | /etc/init.d/nino or WinNT AppToService |
| Auto Report | Auto Report genearation | report.pl | schedule.pl atd |
| Network Scan | Scan network, IP range or seed file | scan.pl | atd |
| GUI | Web interface | nino.pl admin.pl | httpd, Apache mod_perl |
| Server services | Description | Name | Controlled by |
| HTTP | Apache Web Server | httpd | /etc/init.d/httpd or WinNT service |
| Scheduler | Schedule jobs, such as reports | schedule.pl | atd or WinNT service |
| Database | MySQL Database | mysqld | /etc/init.d/mysqld or WinNT service |
| NINO Services | Control NINO services | services.pl | /etc/init.d/nino or WinNT AppToService |
| SNMP Agent | SNMP Agent | snmpd | /etc/init.d/snmpd or WinNT service |
The NINO directory and file structure:
| Description | Directory |
| NINO base directory Unix: ($httpdir) | /var/nino |
| NINO base directory WinNT/2000/2003: ($httpdir) | C:\var\nino |
| Configuration directory: | $httpdir/conf |
| Scripts directory: | $httpdir/scripts |
| HTML document directory: | $httpdir/htdocs/nino |
| Stylesheet directory: | $httpdir/htdocs/nino/css |
| Images directory: | $httpdir/htdocs/nino/images |
| MIBs directory: | $httpdir/htdocs/nino/mibs |
| Upload directory: | $httpdir/htdocs/nino/upload |
| Report directory: | $httpdir/htdocs/nino/reports |
| Report template directory: | $httpdir/htdocs/nino/reports/template |
| NINO scripts in cgi-bin directory: ($cgidir) | $httpdir/cgi-bin |
| NINO scripts in mod_perl directory: ($cgidir) | $httpdir/mod_perl |
| NINO modules directory: ($libdir) | $httpdir/$cgidir/lib |
| Monitoring data collect statistics directory: | $httpdir/$cgidir/statistics |
| Report statistics directory: | $httpdir/htdocs/nino/reports/statistics |
| Description | File |
| NINO configuration file in conf directory: | $httpdir/conf/snmp.ini |
| Nodes map file (pre-processed): | $httpdir/$cgidir/statistics/nodes.txt |
| Nodes map file (post-processed): | $httpdir/htdocs/nino/nodes |
For other web servers a similar directory structure could be used, but it is possible to change this settings by editing the snmp.ini configuration file.
The NINO perl modules are located in de $httpdir/$cgidir/lib directory:
| Description | File |
| NINO initialize | NINOINIT.pm |
| NINO CGI / html functions | NINOCGI.pm |
| NINO SQL functions | NINOSQL.pm |
| NINO Network functions | NINONET.pm |
| NINO Monitoring functions | NINOMON.pm |
| NINO generic main module | NINOMOD.pm |
| NINO SNMP functions | NINOSNMP.pm |
| NINO WMI functions (Windows only) | NINOWMI.pm |
NINO is able to use the UCD / NetSNMP API or the Net::SNMP API from D. Town. The NetSNMP API is preferred, because it is faster and takes less CPU resources. However, the NetSNMP package is not always available on older systems, so the native Perl Net::SNMP API is can also be used. WMI is only available for Windows systems, so a dummy WMI module must be installed on Unix/Linux systems. If compatibility modules are required, please copy them from the $httpdir/$cgidir/libcompat directory to the $httpdir/$cgidir/lib directory and rename the file (remove -dummy, -dtown, -ucd). The NINO compatibility modules are located in de $httpdir/$cgidir/libcompat directory:
| Description | File | Remarks |
| NINO SNMP functions for UCD / NetSNMP API | NINOSNMP-ucd.pm | Should be used if NetSNMP > 5.0 is installed |
| NINO SNMP functions for D.Town Net::SNMP API | NINOSNMP-dtown.pm | Should be used if NetSNMP is not available |
| Disable WMI functions (Linux only) | NINOWMI-dummy.pm | WMI does not work on Unix/Linux |
NINO uses monitoring presets to collect monitoring data. The monitoring preset properties are stored in the snmp.ini configuration file. The monitoring preset contains the following data:
| Key | Description | Remarks |
| oid_$OID_name | SNMP OID's | comma seperated |
| descr_$OID_name | SNMP OID's or function to display description, such as interface name, disk drive etc. | comma seperated |
| ipport_$OID_name | TCP or UDP port | Default 161 |
| version_$OID_name | SNMP version, 1 or 2c | Default 1 |
| hosts_$OID_name | hosts | optional |
| formula_$OID_name | formula to calculate values | optional |
| factor_$OID_name | value description, such as Bit/s or ms | string |
| scalecalc_$OID_name | Display graph Kilo Mega Giga etc, 22 kBit/s or 22000 Bit/s | true or false |
| graph_$OID_name | Graph type | line, filled or sum |
| queue_$OID_name | The queue that collects data of this preset | fast,default,slow,internet or user defined |
| command_$OID_name | SNMP, WMI, HTTP, TCP or script | snmp,http,tcp,script |
The formula uses monitoring data as input. All OID, hosts and ports must match. This must be defined using this format:
host:port:OID
The host and port are empty by default, but can be used to create one monitoring preset for multiple hosts. Multiple hosts setup could be in clustered environments, e.g. user serssions on multiple application servers. There are also functions available to take care of counter data.
| Function | Description | Remarks |
| counter32() | new value - old value | 32 bit |
| counter64() | new value - old value | 64 bit |
| nzero | Prevents divide by zero | |
| duration | duration between new and old value | seconds |
| +-/*() | standard operators |
Example preset IfOctets:
Example preset definitions (Export):
IfOctets:

oid_IfOctets = .1.3.6.1.2.1.2.2.1.10, .1.3.6.1.2.1.2.2.1.16
hosts_IfOctets =
descr_IfOctets = &smart_ifdescr
formula_IfOctets = 8 * (counter32(::.1.3.6.1.2.1.2.2.1.10) + counter32(::.1.3.6.1.2.1.2.2.1.16)) / duration
ipport_IfOctets =
factor_IfOctets = Bit/s
scalecalc_IfOctets = true
version_IfOctets = 1
queue_IfOctets = default
command_IfOctets = snmp
script_IfOctets =
graph_IfOctets = line

Disks:

oid_Disks = .1.3.6.1.2.1.25.2.3.1.6,.1.3.6.1.2.1.25.2.3.1.5
in_Disks =
out_Disks =
hosts_Disks =
descr_Disks = .1.3.6.1.2.1.25.2.3.1.3
formula_Disks = 100 * ::.1.3.6.1.2.1.25.2.3.1.6 / nzero( ::.1.3.6.1.2.1.25.2.3.1.5)
ipport_Disks = 161
factor_Disks = %
scalecalc_Disks = false
version_Disks = 1
queue_Disks = slow
command_Disks = snmp
script_Disks =
graph_Disks = line

ATG Dynamo requests using 4 instances running or 2 servers, showing just one (!) graph:

oid_ATG_WEB1drpTotalReqsServed = .1.3.6.1.4.1.2725.1.4.3,.1.3.6.1.4.1.2725.1.4.3,.1.3.6.1.4.1.2725.1.4.3,.1.3.6.1.4.1.2725.1.4.3
in_ATG_WEB1drpTotalReqsServed =
out_ATG_WEB1drpTotalReqsServed =
hosts_ATG_WEB1drpTotalReqsServed = atg01,atg01,atg02,atg02
descr_ATG_WEB1drpTotalReqsServed =
formula_ATG_WEB1drpTotalReqsServed = counter32(atg01:8871:.1.3.6.1.4.1.2725.1.4.3)/duration , counter32(atg01:8872:.1.3.6.1.4.1.2725.1.4.3)/duration,counter32(atg02:8871:.1.3.6.1.4.1.2725.1.4.3)/duration,counter32(atg02:8872:.1.3.6.1.4.1.2725.1.4.3)/duration
ipport_ATG_WEB1drpTotalReqsServed = 8871,8872,8871,8872
factor_ATG_WEB1drpTotalReqsServed = request/s
scalecalc_ATG_WEB1drpTotalReqsServed = true
version_ATG_WEB1drpTotalReqsServed = 2c
queue_ATG_WEB1drpTotalReqsServed = dynamo
command_ATG_WEB1drpTotalReqsServed = snmp
script_ATG_WEB1drpTotalReqsServed =
graph_ATG_WEB1drpTotalReqsServed = sum

HTTP examples:

HttpGet:

oid_HttpGet =
in_HttpGet =
out_HttpGet =
hosts_HttpGet =
descr_HttpGet =
formula_HttpGet =
ipport_HttpGet = 80
factor_HttpGet = ms
scalecalc_HttpGet = false
version_HttpGet =
queue_HttpGet = internet
command_HttpGet = http
script_HttpGet =
graph_HttpGet = sum

Apache server-status:

oid_apacheStatus = Accesses;Bytes
in_apacheStatus =
out_apacheStatus =
hosts_apacheStatus = http://$ipaddr/server-status?auto
descr_apacheStatus = requests/s;kBytes/s
formula_apacheStatus = counter32(::apacheStatus) / duration
ipport_apacheStatus =
factor_apacheStatus =
scalecalc_apacheStatus = true
version_apacheStatus =
queue_apacheStatus = internet
command_apacheStatus = http
script_apacheStatus =
graph_apacheStatus = line


Execute script:

oid_HostProcs =
in_HostProcs =
out_HostProcs =
hosts_HostProcs =
descr_HostProcs =
formula_HostProcs =
ipport_HostProcs =
factor_HostProcs = none
scalecalc_HostProcs =
version_HostProcs =
queue_HostProcs = slow
command_HostProcs = script
script_HostProcs = $inivar{perl} $inivar{httpcgidir}$inivar{slash}hostprocs.pl
graph_HostProcs = line