NINO Frequently Asked Questions

General:
NINO is based on several functional area's:


What does NINO mean ?

NINO means: Nino Is Not Openview. NINO is a Network Management Solution, a web application to monitor your network devices and network traffic from a web browser. NINO is opensource and may be distributed like Perl, Linux etc. Go to: general description of NINO


Main Menu


On the left side the main menu can be used to navigate. Just click the function you want. In this example the functions are TOP and INFO, this will navigate to the top of this document or to the info page. NINO uses this kind of menu's.

The main screen looks like this:


How do I display a device ?

There are several ways to display a device: via menu MAP, DEVICE or DEVICES. Use menu DEVICES to browse all devices and groups. Open a folder and all devices in that group will be displayed. Click on the host link to display a device. Click on Edit to edit the device or group properties. Open the device in the browser for monitoring details, events and plugins. Open Edit to view monitoring statistics.
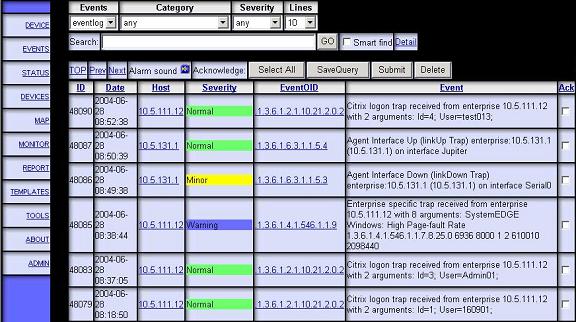
 Click on Events to view the events with the highest severity status of this device. Click on Plugins to open the plugins folder. The Hostmeter plugin can be started from here. Hostmeter will show all system statistics in one dashboard view.

Browser New device or group Name Location Severity
All


Minor
Routers


Minor
10.1.1.10 Device Properties ams3rt10 ams_pop03
Normal
10.1.1.11 Device Properties ams3rt11 ams_pop03
Normal
10.1.1.12 Device Properties ams3rt12 ams_pop03
Minor
Monitor Monitoring properties


FrameRelayFrameRelay properties


HostHost properties


InternetInternet properties


LinuxLinux properties


NetworkLinux properties


WindowsLinux properties


ciscoCATLinux properties


ciscoIOSciscoIOS properties


CiscoIOSavgBusy CiscoIOSavgBusy properties


CiscoIOSavgBusy1CiscoIOSavgBusy1 properties


CiscoIOSavgBusy5CiscoIOSavgBusy5 properties


CiscoMemoryCiscoMemory properties


1-Processor


2-I/O


Plugins


10.1.1.13 Device Properties ams3rt13 ams_pop03
Normal
10.1.1.14 Device Properties ams3rt14 ams_pop03
Normal
10.1.1.15 Device Properties ams3rt15 ams_pop03
Normal
10.9.1.11 Device Properties mdmpool1 ldn-pop01
Normal
10.9.1.12 Device Properties sw406_rt ldn-pop01
Normal
10.52.1.4 Device Properties mnl99 Manila
Normal
10.201.1.5 Device Properties us843_rt05 -
Normal
10.204.1.12 Device Properties us281_rt12 Jersey
Normal
10.25.2.161 Device Properties dv9_rt161 -
Normal
Switches


Normal
Hosts


Normal
Internet


Normal
Networks


Normal
Groups


Normal

A brief description of the buttons used in the device browser can be found in the table below.

ButtonDescription
10.1.1.12 Display device (19" rack view)
Configure Configure monitoring preset, preset group or monitoring configuration for a device
Monitor Open monitoring preset group
Monitor Open monitoring statistics
Data Plot a graph of this monitoring item
Device properties Modify device properties or add/delete a device
Plugins Open plugins such as Hostmeter
Events Show events for this device

To display a new device, click on the menu DEVICE. This function will show the screen below. Enter the hostname or IP address and snmp community string to view a device. Enter more hostnames (comma seperated) to display more devices. The default community string is public. Select Device View in the option-menu and press the GO button to display the device.

Device: List devices
Community:

The checkbox All devices will show a list of devices. Just click on the underlined device to view that device. To view all devices, select or deselect the View checkbox and click Apply to view all. Note: please be patient, it takes time to get all snmp data to view all devices.

Host View Name Location
10.1.1.1 View PServer Quezon
10.1.1.3 View I486 Quezon
10.1.0.1 View LinuxIntGate
212.83.80.55 View LinuxExtGate
194.154.124.5 View
193.172.188.160 View Paradigm Davao
View all devices:
Apply:

The device is displayed as a semi 19'' device. The standard RFC1213-MIB-II is used to display all interfaces. This will make NINO a universal device browser. Click on a button or interface to view more information.

Ethernet0/0-Up-[1] Serial0/0-Up-[2] Null0-Up-[3]
10.1.1.12 System Info Monitor Add to device list Routing Table ams3rt12 - Router

The functions are listed below:

ButtonDescription
System Info Show device information
Monitor Show realtime network traffic (IfOctets)
Add to device list Add or delete a device
Routing Table Show device routing table

The color definitions are listed below:

Interface ColorAdmin statusOper status
Ethernet-Up UPUP
Ethernet-Down UPDOWN
Admin Down DOWNDOWN
Dormant UPTesting/Dormant
Down-Up DOWNUP

The interface definitions are listed below:

InterfaceDescription
Ethernet Ethernet
Token Ring Token Ring
Fiber Fiber, FDDI, Shortwave Gigabit Eth.
Serial Serial, X25, lapb, T1, E1, T3
WAN WAN, Frame Relay
ISDN ISDN
PPP PPP, SLIP
Loopback Loopback
Unknown Unknown, other

By clicking on a function button or interface, the screens below will appear. Some screens provide edit functions, to alter system name, contact or location. Interfaces can also be disabled or enabled. Edit functions use snmpset and need a write community string.


Interface Info

The interface information contains the status, description, network traffic (IfOctets), interface errors, unicast, non-unicast packets and discards. Please notice that the values shown are snmp counters. These counters will increase. Press the button to display realtime network traffic in Bit/s. The snmp counters are equal to the counters displayed at Cisco's show interface command. The interface can be disabled or enabled using the checkbox. This action is done using snmpset.

193.172.188.160-2 Serial0/0
Admin Status: Enable
Operational Status: Up
Speed: 2048000
Apply:
Description In Out
IfOctets: 3249738352 3816732700
IfErrors: 16 0
IfDiscards: 13 170
Unicast: 501279979 476629546
Non Unicast: 1312703 0
Unknown Protocols: 3


Device Info

The device information contains system name, uptime, contact and location. This information may be edited and will be stored using snmpset.

10.1.1.12
Description: Cisco Internetwork Operating System Software IOS (tm) C2600 Software (C2600-IK2S-M), Version 12.1(2), RELEASE SOFTWARE (fc1) Copyright (c) 1986-2000 by cisco Systems, Inc. Compiled Wed 10-May-00 00:03 by linda
Uptime: 171 days, 05:25:52.79
Contact:
Name:
Location:
Apply:

Routing table

This is an example of a routing table (part of it).

Network Mask Next Hop Metric Age Protocol Interface
10.1.0.0 255.255.0.0 10.211.0.1 17779201398270IGRP-
10.4.0.8 255.255.255.252 10.211.0.1 17876483283066IGRP-
10.5.1.0 255.255.255.0 10.211.0.1 4156185622894IGRP-
10.57.39.126 255.255.255.255 10.200.0.1 41561856187IGRP-
10.95.1.0 255.255.255.0 10.211.0.1 6561536791847IGRP-
10.95.2.0 255.255.255.0 10.211.0.1 6561536791847IGRP-
10.101.0.0 255.255.0.0 10.101.0.1 00LocalTokenRing4/0
10.102.0.0 255.255.0.0 10.101.0.40 2818561398273IGRP-
10.105.8.0 255.255.255.0 10.105.8.254 00LocalEthernet5/0
10.105.9.0 255.255.255.0 10.105.9.254 00LocalEthernet5/1
10.105.10.0 255.255.255.0 10.105.9.2 5537536613945IGRP-
10.145.2.0 255.255.255.0 10.218.0.2 55375364294967IGRP-
10.145.3.0 255.255.255.0 10.220.0.2 55375364294967IGRP-
10.145.4.0 255.255.255.0 10.221.0.2 55375364294967IGRP-
10.145.5.0 255.255.255.0 10.222.0.2 55375363696446IGRP-
10.145.6.0 255.255.255.0 10.223.0.2 55375364294967IGRP-
10.145.7.0 255.255.255.0 10.224.0.2 5537536613938IGRP-
10.145.8.0 255.255.255.0 10.225.0.2 55375364294967IGRP-
10.148.0.0 255.255.0.0 10.105.9.2 2818561398273IGRP-
10.200.0.0 255.255.0.0 10.200.0.2 00LocalSerial8/3
10.201.0.0 255.255.0.0 10.211.0.1 22737921398273IGRP-
10.202.0.0 255.255.0.0 10.200.0.1 60239361398273IGRP-
10.203.0.0 255.255.0.0 10.200.0.1 60239361316298IGRP-
10.204.0.0 255.255.0.0 10.211.0.1 6023936637613IGRP-
10.205.0.0 255.255.0.0 10.211.0.1 60239361398273IGRP-
10.207.0.0 255.255.0.0 10.211.0.1 60239361398273IGRP-
10.211.0.0 255.255.0.0 10.211.0.2 00LocalSerial9/4
10.212.0.0 255.255.0.0 10.211.0.1 22737924294967IGRP-
10.217.0.0 255.255.0.0 10.217.0.1 00LocalSerial8/5
10.218.0.0 255.255.0.0 10.218.0.1 00LocalSerial8/6
10.220.0.0 255.255.0.0 10.220.0.1 00LocalSerial8/0
10.221.0.0 255.255.0.0 10.221.0.1 00LocalSerial8/1
10.222.0.0 255.255.0.0 10.222.0.1 00LocalSerial8/2
10.223.0.0 255.255.0.0 10.223.0.1 00LocalSerial9/1
10.224.0.0 255.255.0.0 10.224.0.1 00LocalSerial9/0
10.225.0.0 255.255.255.252 10.225.0.1 00LocalSerial9/3
10.226.0.0 255.255.255.0 10.105.9.2 405378561398274IGRP-
10.233.0.0 255.255.0.0 10.211.0.1 6535936791848IGRP-
10.234.0.0 255.255.0.0 10.211.0.1 6535936791848IGRP-
10.250.0.0 255.255.255.0 10.250.0.1 00LocalDialer1
10.250.1.0 255.255.255.0 10.250.0.2 012LocalTokenRing4/0
10.254.5.0 255.255.255.0 10.200.0.1 19156481398273IGRP-
10.254.52.0 255.255.255.0 10.211.0.1 2427648791848IGRP-
10.255.1.0 255.255.255.0 10.211.0.1 012LocalTokenRing4/0
89.0.0.0 255.0.0.0 10.105.9.2 2818561398274IGRP-
141.128.224.0 255.255.255.0 10.105.9.2 405378561398274IGRP-


How do I modify, add or delete a device ?

In the DEVICES menu or in the device display a device may be added or deleted. Click on Edit to edit the device properties. Click on Events to view the events with the highest severity status of this device. Click on Hostmeter to open the Hostmeter screen. Hostmeter will show all system statistics in one dashboard view.

Browser New device or group Name Location Severity
All


Minor
Routers


Minor
10.1.1.10 Device Properties ams3rt10 ams_pop03
Normal
10.1.1.11 Device Properties ams3rt11 ams_pop03
Normal
10.1.1.12 Device Properties ams3rt12 ams_pop03
Minor
Monitor Monitoring properties


Plugins


Device properties


Events


10.1.1.13 Device Properties ams3rt13 ams_pop03
Normal
10.1.1.14 Device Properties ams3rt14 ams_pop03
Normal
Switches


Normal
Hosts


Normal
Internet


Normal
Networks


Normal
Groups


Normal

Clicking the Add to device list button will display this screen. Just fill in the form and submit changes. Changes are applied to NINO only and will not affect the device.

Device Properties
Host:
Community:
Name:
Location:
Operating System:
Version:
Description:
Device type: Edit
Add to list:
Delete from list:
Auto redraw node map:
Apply:

If the device is new, the monitoring preset groups will be auto-discovered. If the device is a server, also the most important host processes will be detected and monitored. In the next screen this may be changed and saved. Click on All presets to setup individual monitoring presets for this device. A preset group is a group of monitoring presets. A monitoring preset is used to collect monitoring data, such as network traffic or CPU utilization.

Preset Groups for US383ADS01 Monitor Status
FrameRelay
Internet
Linux
Network
WindowsPlot Graph
ciscoCAT
ciscoIOS
All presets
Apply changes:


Monitoring

NINO uses monitoring to collect data or get status info. Monitoring can be done realtime on the fly or in the background using Collect Monitoring Statistics. The NINO monitoring toolkit has several components:

Monitor Presets are used to measure all kinds of values, such as network traffic (IfOctets), Errors, HTTP Get reponse times, SMTP status and more. Monitor Presets can be customized and added. Monitoring groups can be created to group a logical set of hosts with monitored interfaces. Groups can be used in reporting, monitor status and realtime view. Status Monitoring can be enabled to send SNMP traps if hosts do not respond. The Node Up/Down events will be stored in the eventlog database. Using event actions, e-mail or SMS notification can be configured.

How do I monitor ?

The basic steps to monitor a device are very simple. Select in the main menu the DEVICES function. Open the group and the device you want to monitor. Click on the Configure button next to Monitor to setup monitoring for this host.

Browser New device or group Name Location Severity
All


Minor
Routers


Minor
10.1.1.10 Device Properties ams3rt10 ams_pop03
Normal
10.1.1.11 Device Properties ams3rt11 ams_pop03
Normal
10.1.1.12 Device Properties ams3rt12 ams_pop03
Minor
Monitor Monitoring properties


Plugins


Device properties


Events


10.1.1.13 Device Properties ams3rt13 ams_pop03
Normal
10.1.1.14 Device Properties ams3rt14 ams_pop03
Normal
Switches


Normal
Hosts


Normal
Internet


Normal
Networks


Normal
Groups


Normal

In this screen the preset groups are displayed. The easiest way to setup monitoring for this host is auto-discovery using the Discover button. For advanced monitoring other preset groups or individual monitoring presets can be enabled for a device. Click on the All Presets link to get a list of all presets. Check the presets in the Monitor colum to monitor the device with selected presets. Check the presets in the Status colum enable status monitoring. With status monitoring alarms are send to the eventlog. Default the uptime is checked to monitor the status of a device. If a device does not respond, the device is reported down with a Node Down event. The HostProcs preset is used to monitor server processes. If a process is down, this will be reported in the eventlog. Preset groups are groups of presets to make monitoring easier to use. Click on the preset group link to edit a preset group.

Preset Groups for US383ADS01 Monitor Status
FrameRelay
Internet
Linux
Network
WindowsPlot Graph
ciscoCAT
ciscoIOS
All presets
Apply changes:


How do I use realtime monitoring ?

Select in the main menu the DEVICES function. Then click on a host. The host will appear in a semi 19" rack device view. Click the Monitor button in the device view to view the realtime monitoring. A graph of all monitoring during last hours on that device will be plotted. The screen will be refreshed every minute.


The monitor screen

The monitor screen can be used to view graphs, configure monitoring presets and preset groups. Select in the main menu the MONITOR function. The monitor screen will display a preset group browser. Opening a preset group will show inidividual monitoring presets. In the example below the preset group Host contains the monitoring presets Disks, HostCPU, IfErrors and IfOctets. Opening a monitoring preset will show all devices that are monitored with that preset. Opening a device will show all monitored objects, such as interfaces or disk partitions. Click on the Plot graph button to plot a graph. Click on the host link to edit graph settings and plot a graph. Click on the Preset properties icon to apply the preset to multiple hosts or edit the monitoring preset. The monitor group view will display the status of monitoring presets combined in a group. These groups can be configured using the Edit button and used for reporting. To view all monitoring presets, click on All.

Monitor group view:
Collect Monitoring Statistics
OpenOpenFrameRelayFrameRelay properties
CloseCloseHostHost properties
OpenOpenDisksDisks properties
CloseCloseHostCPUHostCPU properties
OpenOpen10.1.1.1Plot graph
OpenOpen10.1.1.2Plot graph
OpenOpenIfErrorsIfErrors properties
OpenOpenIfOctetsIfOctets properties
OpenOpenInternetInternet properties
OpenOpenLinuxLinux properties
OpenOpenNetworkNetwork properties
OpenOpenWindowsWindows properties
OpenOpenciscoCATciscoCAT properties
OpenOpenciscoIOSciscoIOS properties
OpenOpenAll

The Status button will show the realtime status of a monitoring group using meters and bars.


How do I plot a graph ?

Select in the main menu the MONITOR function. The monitoring browser screen will be displayed. Then open the preset group and open the preset. Select the host link to customize graph settings or select the Plot graph button to view the last hours of the graph. The next step is to select the interfaces to plot. Default the actual network traffic, this is the Collect radio button is selected. Select Trend to plot average traffic per day. Click Apply to plot the graph. Select the Report radiobutton and choose a monitoring group to add the interfaces to a monitoring group. The monitoring groups can be used again to plot graphs in reports and templates.

Plot IfOctets of localhostSelect
1-Ethernet0
2-Serial0
Start date:
End date:
Add to monitoring group:
Plot graph:
Select all:
Apply:

The network traffic from the selected interfaces will be plotted in a graph. Move with pressed mouse button in the graph area or scale area to zoom or move the plotted data. Click on the sum button to display the sum of all data in a graph. All data is stacked on top of eachother. Click on the fill button to display a filled or line graph. The Report link will plot a minimal report. The Data link will open the raw data, e.g. exporting to Excel.


How do I activate monitoring presets on multiple hosts ?

Select in the main menu the DEVICES function. The device browser screen will be displayed. Then open monitoring on a device and click on the preset group where the preset is located. Click on the properties Properties icon of the monitoring preset. Checking the hosts using the checkbox will activate the monitoring preset for all selected hosts in the list. Click Apply to submit. All checked hosts are now monitored. If the device list is very long use the search function. Click on the Configure preset link to configure the preset.

Monitoring Search fieldSearch
Configure preset IfOctets
HostNameLocationSeverity
dv89rt01dv89rt01Davao Datacenter 1
Normal
dv89rt02dv89rt02
Normal
dv89rt03dv89rt03Datacenter 1
Normal
dv89sw01dv89sw01Datacenter 1
Normal
dv89sw02dv89sw02
Normal
DV89FS01FileserverDatacenter 1
Minor
How do I activate preset groups on multiple hosts ?

Select in the main menu the DEVICES function. The device browser screen will be displayed. Then open monitoring on a device and click on the preset group properties Properties icon. Checking the hosts using the checkbox will activate the monitoring preset for all selected hosts in the list. Click Apply to submit. All checked hosts are now monitored. Click on the Edit presets in preset group link to configure a preset group.

Monitoring Search fieldSearch
Edit presets in Network
HostNameLocationSeverity
dv89rt01dv89rt01Davao Datacenter 1
Normal
dv89rt02dv89rt02
Normal
dv89rt03dv89rt03Datacenter 1
Normal
dv89sw01dv89sw01Datacenter 1
Normal
dv89sw02dv89sw02
Normal
DV89FS01FileserverDatacenter 1
Minor


How do I edit Preset Groups ?

The preset group is a logical group of related monitoring presets, such as the Windows or Network preset group. Select in the main menu the DEVICES function. The Preset Groups have icons. Click on the Properties button and on the Edit presets in preset group link to configure the preset group.

Edit Preset Group Collect Status
Preset Group:
CPU
CiscoCPU1min
CiscoCPU5min
CiscoCPU5sec
CiscoIOSavgBusy
CiscoIOSavgBusy1
CiscoIOSavgBusy5
CiscoMemory
Disks
FrOctets
FtpPing
HostProcs
HttpGet
HttpPing
IfErrors
IfOctets
Load1
Load15
Load5
Ping
SmtpPing
SysDescr
SysLocation
Uptime
WMI_CPU
WMI_LogicalDisk
WMI_memory
Apply:

What is a monitoring preset ?

A monitoring preset is a dataset of monitoring properties. A preset can be a dataset to monitor network traffic, disks, CPU or whatever you want to monitor. NINO can use SNMP, WMI, TCP, HTTP or using free commands to monitor devices. NINO provides also tools to monitor TCP and HTTP response in ms.

There are several kinds of monitoring:

One example is the monitoring of network traffic. The IfOctets preset contains the OID's of incoming (snmp oid => .1.3.6.1.2.1.2.2.1.10.interfaceIndex - IfInOctets) and outgoing (snmp oid => .1.3.6.1.2.1.2.2.1.16.interfaceIndex - IfOutOctets) traffic. Also the value description (Bit/s) and description OID to display interface names (e.g. eth0) is defined in the preset. In general the next items can be defined in the preset parameters:

What is service response ?

Service response monitoring is used to monitor HTTP or TCP services. FTP, mail and web response can be monitored in a detailed way. Network and DNS delays are measured and also application response with the HTTP fetch time. Using this tool it is possible to troubleshoot performance issues, detect network or DNS problems and see how your web application performs. Click on menu TOOLS and click on the Service Response link.

Service Response:
http://www.cnn.com
Total: 1066.2 ms Save as preset: Monitoring Preset
DNS 122.056 ms Time to resolve hostname to ip: 64.236.16.116
Network 169.273 ms Time to setup network connection
Application 107.971 ms Application response
Fetch 666.9 ms Time to fetch content data
Content:

Service response can also be used to monitor values from a web based application. Example: application writes to HTML page. This page can be used as input for NINO.

VariableValue
Web users:122
CPU:12.5 %
Cache:876 MB

Select servcice web variables to edit the variables you want to monitor. NINO will use a search string and capture the next word. So in this example the variable / search string Web users: will have result: 122. Click on the Save button to create a monitoring preset. Using this feature NINO is able to log, create graphs and reports using web pages as input.

Preset Web variables scan Result Description
Preset:
URL:

Port:

Scan:Enter search string, the next word
is the result and will be logged.
Enter description:
S0122
S112.5
S2876
S3
S4
S5
S6
S7

Example: The Apache server-status page can be monitored using Service response - web variables.


What are IfOctets and how does Collect work ?

The network traffic is monitored to read snmp counters from a device interface. But there is more: not only the interface traffic can be monitored, but also the errors, Frame Relay per DLCI, IP traffic or any other traffic can be monitored. The only restriction is the support of snmp from the device.

Description of snmp counters:

SNMP PresetDescriptionValue
IfOctetsInterface traffic in octets8 bits
FrOctetsFrameRelay traffic in octets8 bits
IfErrorsInterface ErrorsErrors
UnicastInterface unicast packetsPackets
NUnicastInterface Non Unicast packetsPackets

The interface information screen will show snmp counters. NINO will use a formula to convert Octets/s into Bit/s in the monitoring graph or in realtime monitoring screens. How does it work ? Every interval the snmp counters are read form a device. To get the monitoring data, you'll need two counters and the time interval in seconds. These values are computed into a Value/S. The Octet values are converted in Bit/s. Example:


TimeIN Octets counterOUT Octets counter
t=0 seconds32410042541164
t=10 seconds32945112611541
The total IN octets in 10 seconds:   3294511 - 3241004 = 53507
The total OUT octets in 10 seconds:  2611541 - 2541164 = 70377

Total IN + OUT octets in 10 seconds: 53507   + 70377   = 123884 

Formula: (Octet = 8 bit)

   network traffic = ( 8 * Octets ) / (tend - tstart) in Bit/s

Total:  (8 * 123884) / 10 = 99107 Bit/s


This formula needs to be entered in the preset configuration screen. The formula uses standard calculus notation as input and has some pre-defined functions. The formula field may be left empty if no formula is used.

  Counter32( host:port:snmp_oid )         :   32 bit counter function to calculate new value - old value
                                              the host and port must be left empty if no specific host or port is defined
                                              other than default. 
  duration                                :   duration in seconds, new timestamp - old timestamp from logfile
  * / + - ( )                             :   standard calculus symbols

Example IfOctets:

  8 * (counter32(::.1.3.6.1.2.1.2.2.1.10) + counter32(::.1.3.6.1.2.1.2.2.1.16)) / duration


How do I modify a monitoring preset ?

Click on menu MONITOR, browse a preset from the screen and click on the Edit Monitor Preset icon. Click on the Configure preset link to edit the preset. Create a new preset by changing the preset name.

This example shows the network traffic IfOctets preset. The total network traffic needs to be calculated using formula below. The IfInOctets and IfOutOctets are added and a Bit to Byte conversion is calculated. Because IfInOctets and IfOutOctets are counter-values, the counter32 function is used to substract new value - old value.

Monitoring Preset
SNMP preset name:
SNMP udp port:
OID:
OID In:
OID Out:
OID Description - none:
Command:snmp
SNMP version:
Formula:
Hosts:
Thresholds:new
Value description:
Rescaling (k,M):
Graph type:
Monitoring queue: Edit
Run snmpwalk:.1.3.6.1.2.1.2.2.1.10 , .1.3.6.1.2.1.2.2.1.16
Apply:

This example shows the Load15 preset. The average system Load of the last 15 minutes is monitored with this preset. The threshold levels are set to trigger alerts in the eventlog.

Monitoring Preset
SNMP preset name:
SNMP udp port:
OID:
OID Description - none:
Command:snmp
SNMP version:
Formula:
Hosts:
Thresholds:major normal warning new
Value description:
Rescaling (k,M):
Graph type:
Monitoring queue: Edit
Run snmpwalk:.1.3.6.1.4.1.2021.10.1.3.3
Apply:


What is a monitoring threshold ?

Optional threshold levels can be defined to trigger alerts if the threshold levels are exceeded. Each threshold has a Lower limit and Upper limit and a SNMP trap OID. If the monitoring data enters the range between the lower or upper limit a SNMP trap will be send. The alert will appear in the eventlog, including a link to plot a graph.

The alerts also need to be configured in the eventlog. For each threshold an event must be defined with the right severity level. Also event recovery must be configured to clear the high severity status if the level is back to normal again. Optional event actions can be configured to send e-mail alerts or escalation events. An escalation event could be triggered if the monitoring data exceeded the threshold limit (minor event A) and does not recover in 15 minutes (critical event B). Common sense is to configure e-mail notification only on escalation events to prevent spam. The "threshold" events should be configured to send escalation and recovery events or else it will not work.

The threshold name, lower limit, upper limit and SNMP trap OID must be filled in. Optional filters, such as the colum in the monitoring data file or hosts can be filled in to send alerts only if applicable. Escalation events must be configured in the EVENTS editor.

Monitoring thresholds Load15
Name:
Lower limit:
Upper limit:
SNMP trap:
Colum (empty for all):
Hosts:
Apply:


What is a monitoring queue ?

By default NINO has several monitoring queues to handle monitoring. Each queue can be configured with a cycle duration in seconds. The services process will control all monitoring queues, such as manual stop or start, automatic restart if the queue is down or hanging.

It is possible to create new monitoring queues and alter cycle times. Also test queues can be defined to test new monitoring presets or realtime troubleshooting with a cycle refresh of 10 seconds.

Monitoring queue
Monitoring queue: Requires restart
Cycle (in seconds):
Service:
Command:


SNMP & WMI Tools

Select in the main menu the TOOLS function. The next options are available.

Devices & Groups
New device
Device type
New group
Group Properties
Discover IP range
Discover network
Discover using seed file

SNMP & WMI Tools
Device
Scan MAC address / hosts
SNMP Walk
SNMP Trap send
Search MIB database
MIB Browser
Import MIB files
WMI Browser
Service Response


How do I scan a IP range ?

Select in the main menu the TOOLS function. Click on the link Discover IP range. Fill in the start IP address and the end IP address of the IP range. The alternative community string can be used for devices using another community string than the default public. Example:


Scan IP IP-Address
Start IP range:
End IP range:
Alternate SNMP community:
Default SNMP community: public

The scan will be scheduled at once and the results are stored in a scan report in the report directory. This report auto-refreshes to view the status. Hostname, IP and network information is stored the database and summarized in the report.


How do I discover a network ?

Select in the main menu the TOOLS function. Click on the link Discover network. Fill in the default gateway IP address and the maximum nodes to be scanned in a subnet. The alternative community string can be used for devices using another community string than the default public. Example:


Network Scan IP-Address
Default gateway:
Max nodes in subnet scan:
Alternate SNMP community:
Default SNMP community: public

The scan will be scheduled at once and the results are stored in a scan report in the report directory. This report auto-refreshes to view the status. Hostname, IP and network information is stored the database and summarized in the report.


How do I discover devices using a seed file ?

Select in the main menu the TOOLS function. Click on the link Discover using seed file. Upload the seed file containing hostnames or IP addresses you want to discover. The alternative community string can be used for devices using another community string than the default public. Example:


Discover File
File:
Default SNMP community:public
Alternate SNMP community:
Apply:

The scan will be scheduled at once and the results are stored in a scan report in the report directory. This report auto-refreshes to view the status. Hostname, IP and network information is stored the database and summarized in the report.


snmpwalk

Select in the main menu the TOOLS function. Click on the link snmpwalk. Fill in the hostname, community string and the OID. Default UDP port 161 is used, but when using Oracle OEM, port 1161 is used for the native agent. Applications like ATG Dynamo use udp 8870, 8871 etc. to read out session information and Java free memory.


SNMP request
Host:
udp port:
Community:
OID
SNMP version:
Apply:


MIB Browser

Select in the main menu the TOOLS function. Click on the link MIB Browser. The next browser screen will show all information of the loaded MIBs. It is required to import MIB files first. MIB files are located in the docroot/mibs directory. The MIB information is stored in the MySQL database. From the MIB browser it is easy to test SNMP queries and create monitoring presets. Select a MIB to view information. Click on the OID to perform a SNMP walk. Apply will create a monitoring preset using the MIB information.


WMI Browser

The Windows Management Instrumentation (WMI) can be used to get windows information. However it is required to setup a windows administrative account and password in NINO. This is done in menu ADMIN, SECURITY. To browse WMI, select in the main menu the TOOLS function. Click on the link WMI Browser. Fill in the hostname and optional a search string to find WMI classes. Then a list of WMI classes will be displayed. Select a class to get all information from that class on the selected host. It is also possible to create monitoring presets from here. Just click on a class element you want to monitor, the monitoring preset edit screen will appaer to make changes.

WMI
Windows Host:
Search WMI Class:


How does NINO handle reports ?

The reporting toolkit is build on several components:

The first step is to create a HTML template suited for your situation. The next step is to use inline script functions to create graphs and event database info. The next step is to define monitoring groups, this is a group of hosts with monitored interfaces. Such a group can be selected when creating a report, so only the monitoring results of that group are displayed in the graphs.

How do I use templates ?

Report HTML templates are used for reporting and the template function. Using inline Perl scripting, standard NINO functions can be embedded in the report. When generating a report the inline script functions are executed, so a database table or monitoring graph is displayed inside the report. This is a list of NINO functions:

Select menu TEMPLATES and click on Edit to edit a template. Just enter HTML and copy - paste functions in the textarea. Use the Save button to save the template. To use the template function, click on the template filename link. The template function can process templates on the fly using the group Default. Becasue no day or month info is entered all data is used.

Create Report Template
Select function: Query: Please Copy and Paste function into textarea
Save:
How do I make a report ?

Select in the main menu the REPORT function. This screen will appear. NINO will generate a HTML report of the monitoring results and event database information. Default a network traffic report is generated using the monitoring data. To customize your reports, please select HTML templates with inline scripting.

To make a report, select a template and define the startdate until enddate the report should be. All monitoring collect or trend data, database eventlog and userlog data from the startdate until the enddate will be used. The monitoring data defined in the selected group are plotted in a graph (using graph width and height input in pixels). Click on Edit to modify groups.

Generate Report
Report template:
Report filename:
Start date:
End date:
Graph pixel width:
Graph pixel heigth:
Monitor Collect:
Monitor Trend:
Monitor Group:
Report manager: Report manager
Apply:

To create or edit monitoring groups, click on Edit and the screen below can be used to enter a device, monitor preset, interface and a description. All host/preset/interfaces in this group will be used in a report. To add an interface, click on Add, select a device and interface using the MONITOR function. In the last screen select the radio button Report to add the interface in the report list. The Default group is used for automatic reporting and the template function. Enter another group name to create a new group.

Edit Group Preset Colums Description User Description Delete
1-lo0 2-ce0 3-dman0 4-qfe0 5-qfe0:1 6-qfe4 7-qfe4:1
Add monitor: Add
( select monitor preset,
choose host and items to monitor,
select Add to monitoring group and apply)
Save as group:
File Manager

Go to menu ADMIN and click on FILEMGR to manage NINO files. The file manager enables you to view, download, upload and delete files. This can be used to view and manage report files, view or delete raw monitoring data, upload your own alert sounds or upload images to create new device types.


File manager
/var/nino/htdocs/nino/sounds View Size
../Delete selected items
gameover.wavDownload36.7 kB
redalert.wavDownload11.1 kB
startrek.wavDownload12.3 kB
twilight.wavDownload17.3 kB
How do I configure SNMP on cisco IOS ?

A cisco router or switch must be configured to enable SNMP. Cisco IOS commands can be used in the example below.

To start a session, login and go to enable mode.

Configure SNMP:

login
ena
conf t
 snmp-server community my_write_string RW
 snmp-server community my_read_string RO
 snmp-server contact my_contact
 snmp-server host my_nino_host trap public snmp

Configure extended interface description:

conf t
 interface Serial0
  Description my_link_to_NewYork_modem808756309
  CTRL-Z