
NINO is a network management solution to manage routers, switches, servers and applications. Using realtime monitoring, event monitoring and reporting the health and status of your network can be monitored. On high severity events NINO can send e-mail notification. NINO can be used from any place in the network or event the internet just using a web browser. This is an example to manage servers and the network.

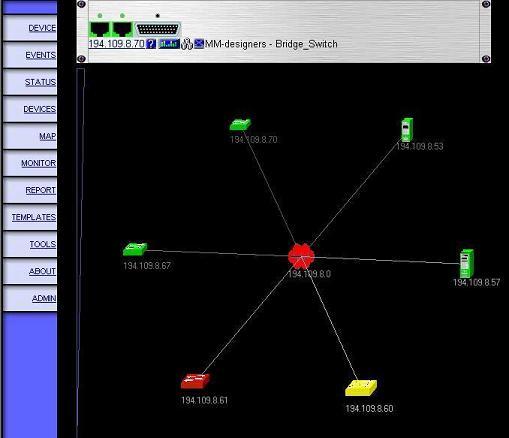
The main screen, main menu in the left, device view on top and the 3D Device status view below:
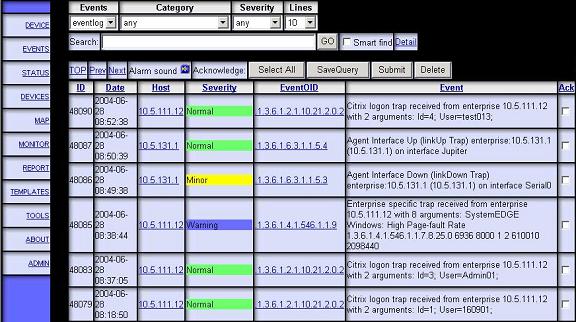
The event screen:
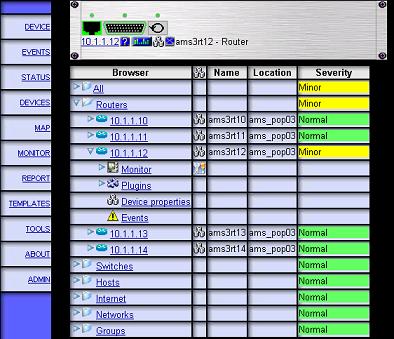
The device browser, with severity status, monitoring drill down and plugins:
NINO can manage all SNMP and WMI capable devices. The devices are displayed in a general way, as semi 19'' devices with the status of all physical and logical interfaces. NINO can show information per device:
NINO uses SNMP and WMI to monitor systems and applications. The most important system statistics, such as CPU load, memory, storage and processes can be monitored and viewed in graphs. Hostmeter can display this statistics in one dashboard view using meters and bars. Customized monitoring presets can be realized using the MIB browser or WMI browser.
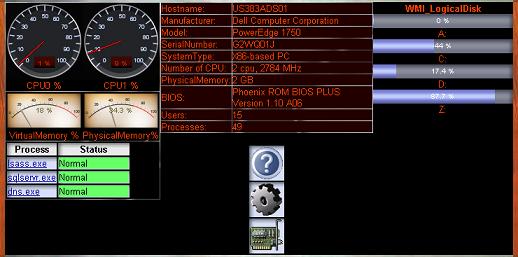
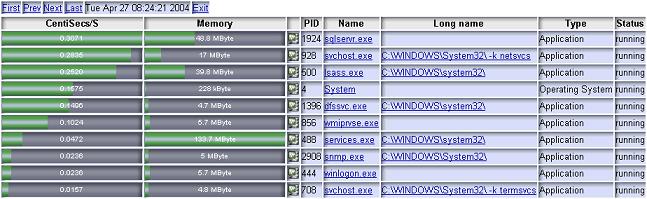
Server processes can be monitored with NINO. Alarms are displayed in the eventlog if a process is down and in Hostmeter all relevant processes are displayed.
NINO can receive SNMP traps and store them into the eventlog database. Automated recovery using an event correlation table is also available. Event actions can be defined on high severity events, such as e-mail notification on a site down event. Also commandline or trap forwarding actions can be defined. For integration into larger networks traps can also be forwarded using source filters (ie. forward all traps coming from 10.1.1.*). The events can be used for reporting and realtime status view. The event function can filter out events in many ways, filtered by severity, category or search string. Also an event summary and SQL query function is available.
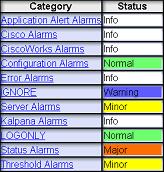
The status of your network can be monitored in a the category status window. This function will extract all severity info from the eventlog and categorize it. This is an easy way to get a quick overview. Categories can be customized.
The report functions are based on HTML and can be generated by NINO any time you want. Using HTML templates, it is possible to create your own customized reports. NINO has embedded inline Perl functions to display network traffic, eventlog, userlog and device availability in a report. It is also possible to use auto-report functions. Every day or every month a report can be generated using your own customized HTML template.
Device & network discovery:
Monitoring:
Device browser:
Tools:

NINO Administration & Diagnostics:
NINO runs on a Unix or Windows server. Apache (mod_perl, CGI) or Microsoft IIS (CGI) are tested and proven to be stable. Clients have to run Netscape 6 or Microsoft Internet Explorer 5 or higher. NINO performs best with the Apache Mod_perl module. Java Applets are used on the client side to display monitoring graphs and the NodeMap.
Copyright & Distribution rules: